
Awhile ago, I wrote some code to graph my email behavior (in the spirit of Stephen Wolfram). I have been teleworking for the last 11 weeks (due to COVID19), and was curious to see how this shows up in my email behavior. First let’s start with a baseline by looking at average behavior over the last 5 years.
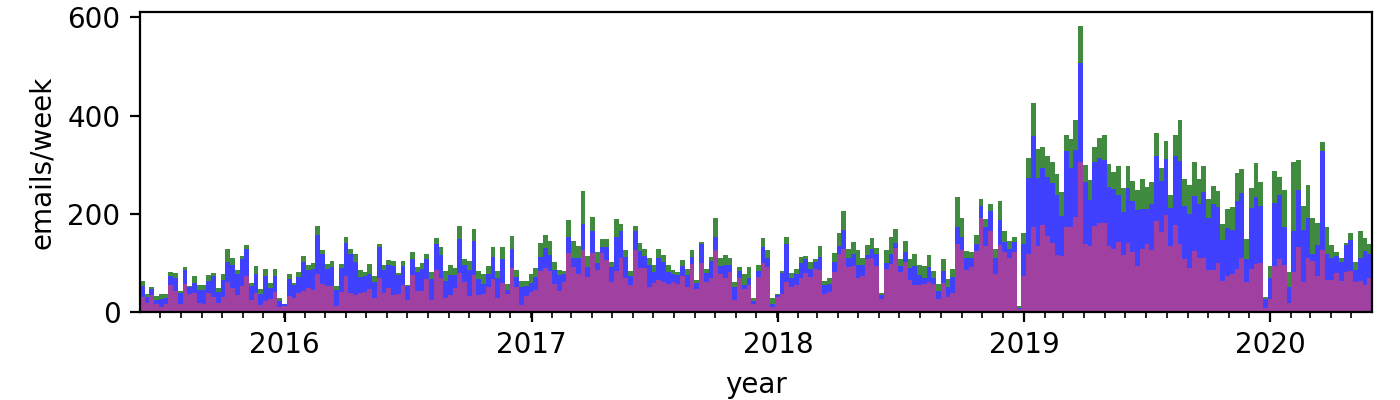
This is a stacked plot, with email I send (purple, bottom), and email I receive (blue for internal email, green for external).
There are many caveats. This is work email only. I am (intentionally) only measuring archived email, and exclude spam or any email that I delete rather than archive. This leads to the ‘sent’ (which is always saved) being much larger than ‘received’ (since I only archive things that are useful, not the thousands of emails generated every time someone needs to schedule a meeting). The data has some artifacts related to changes in how the lab has managed email over the years (and changes in my threshold for delete vs. archive). Nevertheless, it gives us something to consider.
The overall increase in email volume over time is apparent. The dip at the end of December each year of course coincides with holidays. We can also look at the average distribution of email over the course of a week:
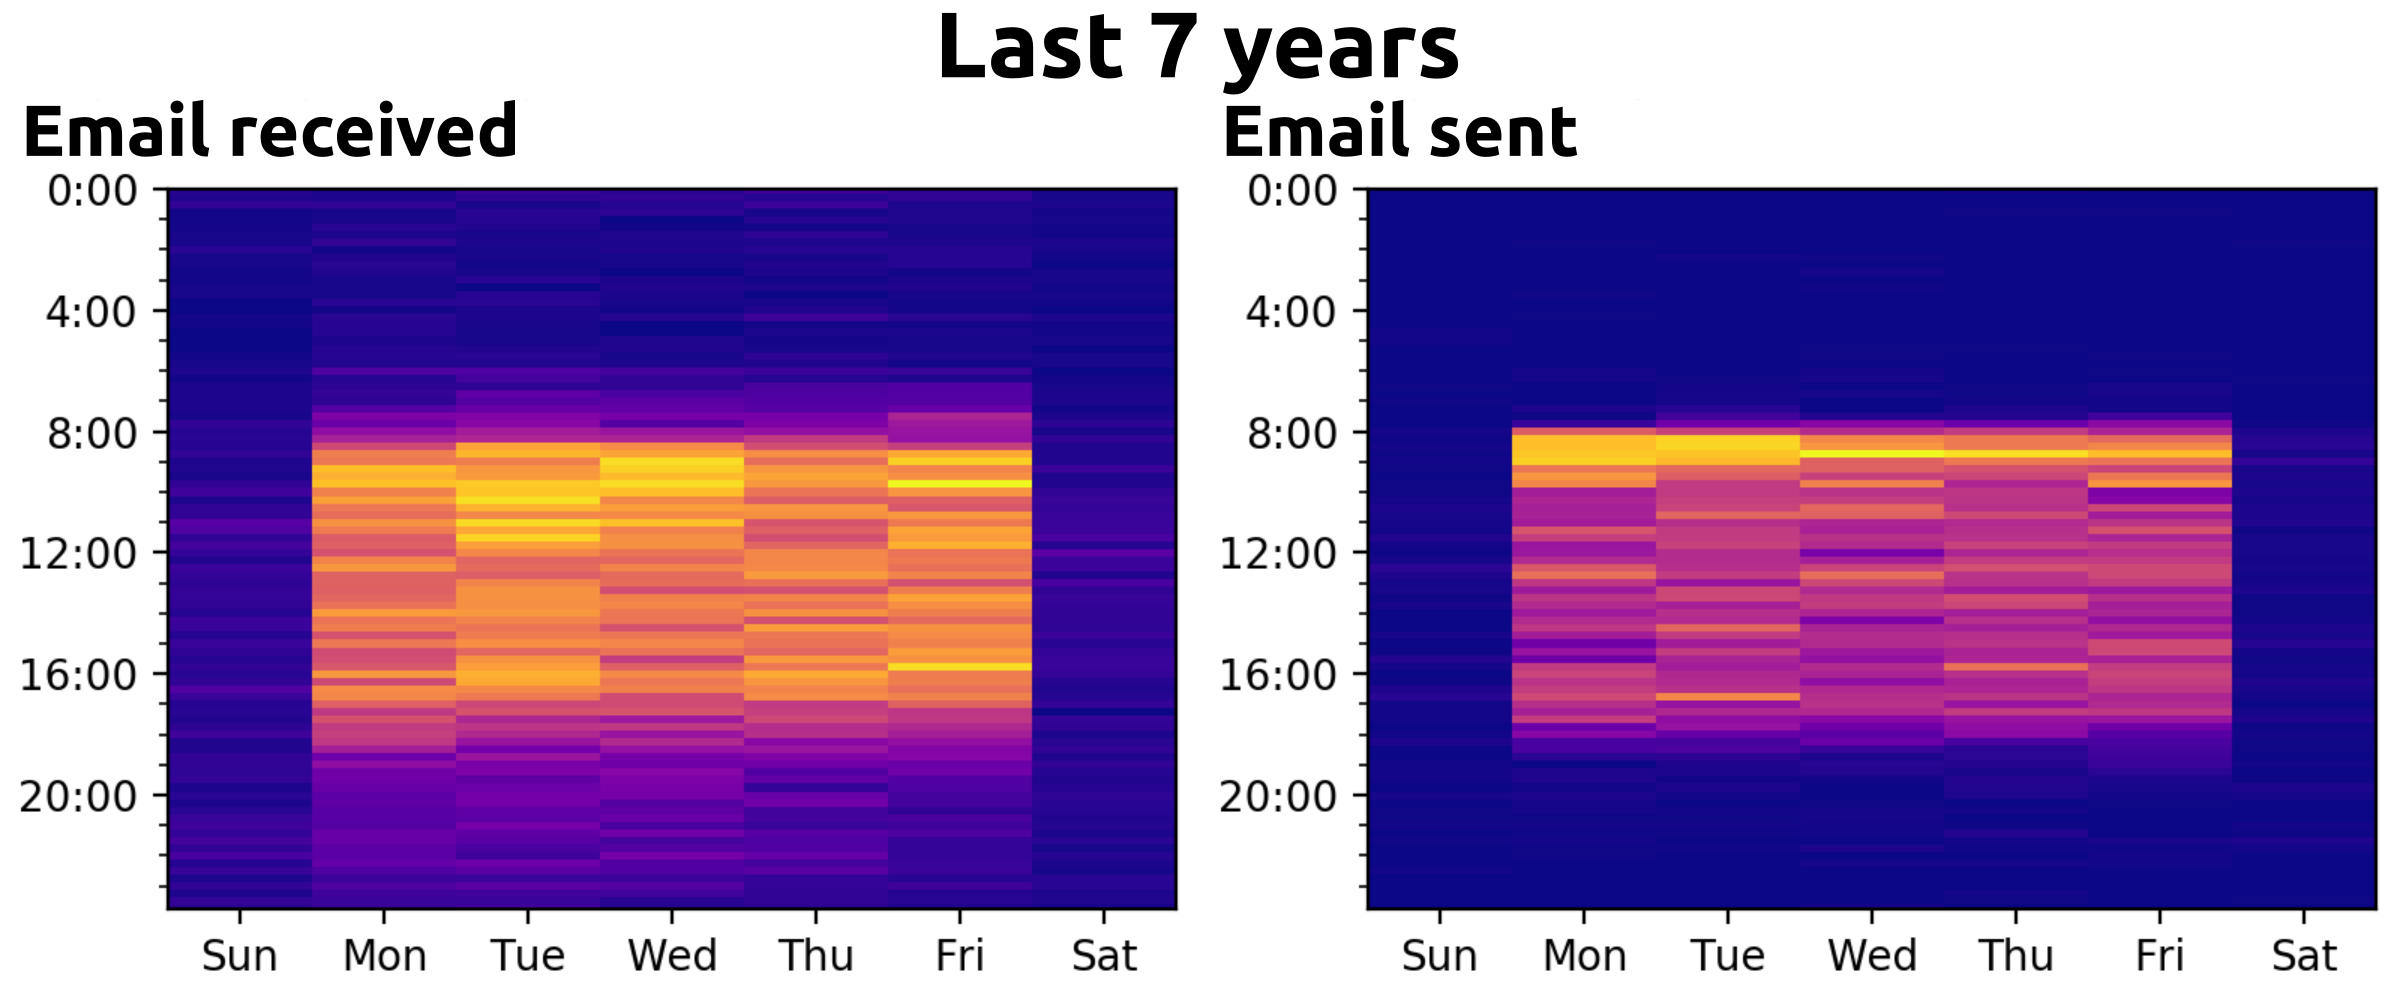
Emails obviously come in mostly during working hours (though there is plenty of off-hours traffic from automated systems, other time zones, and colleagues who just aren’t sensible). My email sending follows clear patterns, including how I set aside weekday morning to handle backlogs of low-priority requests. Now we can compare during-quarantine to before-quarantine.
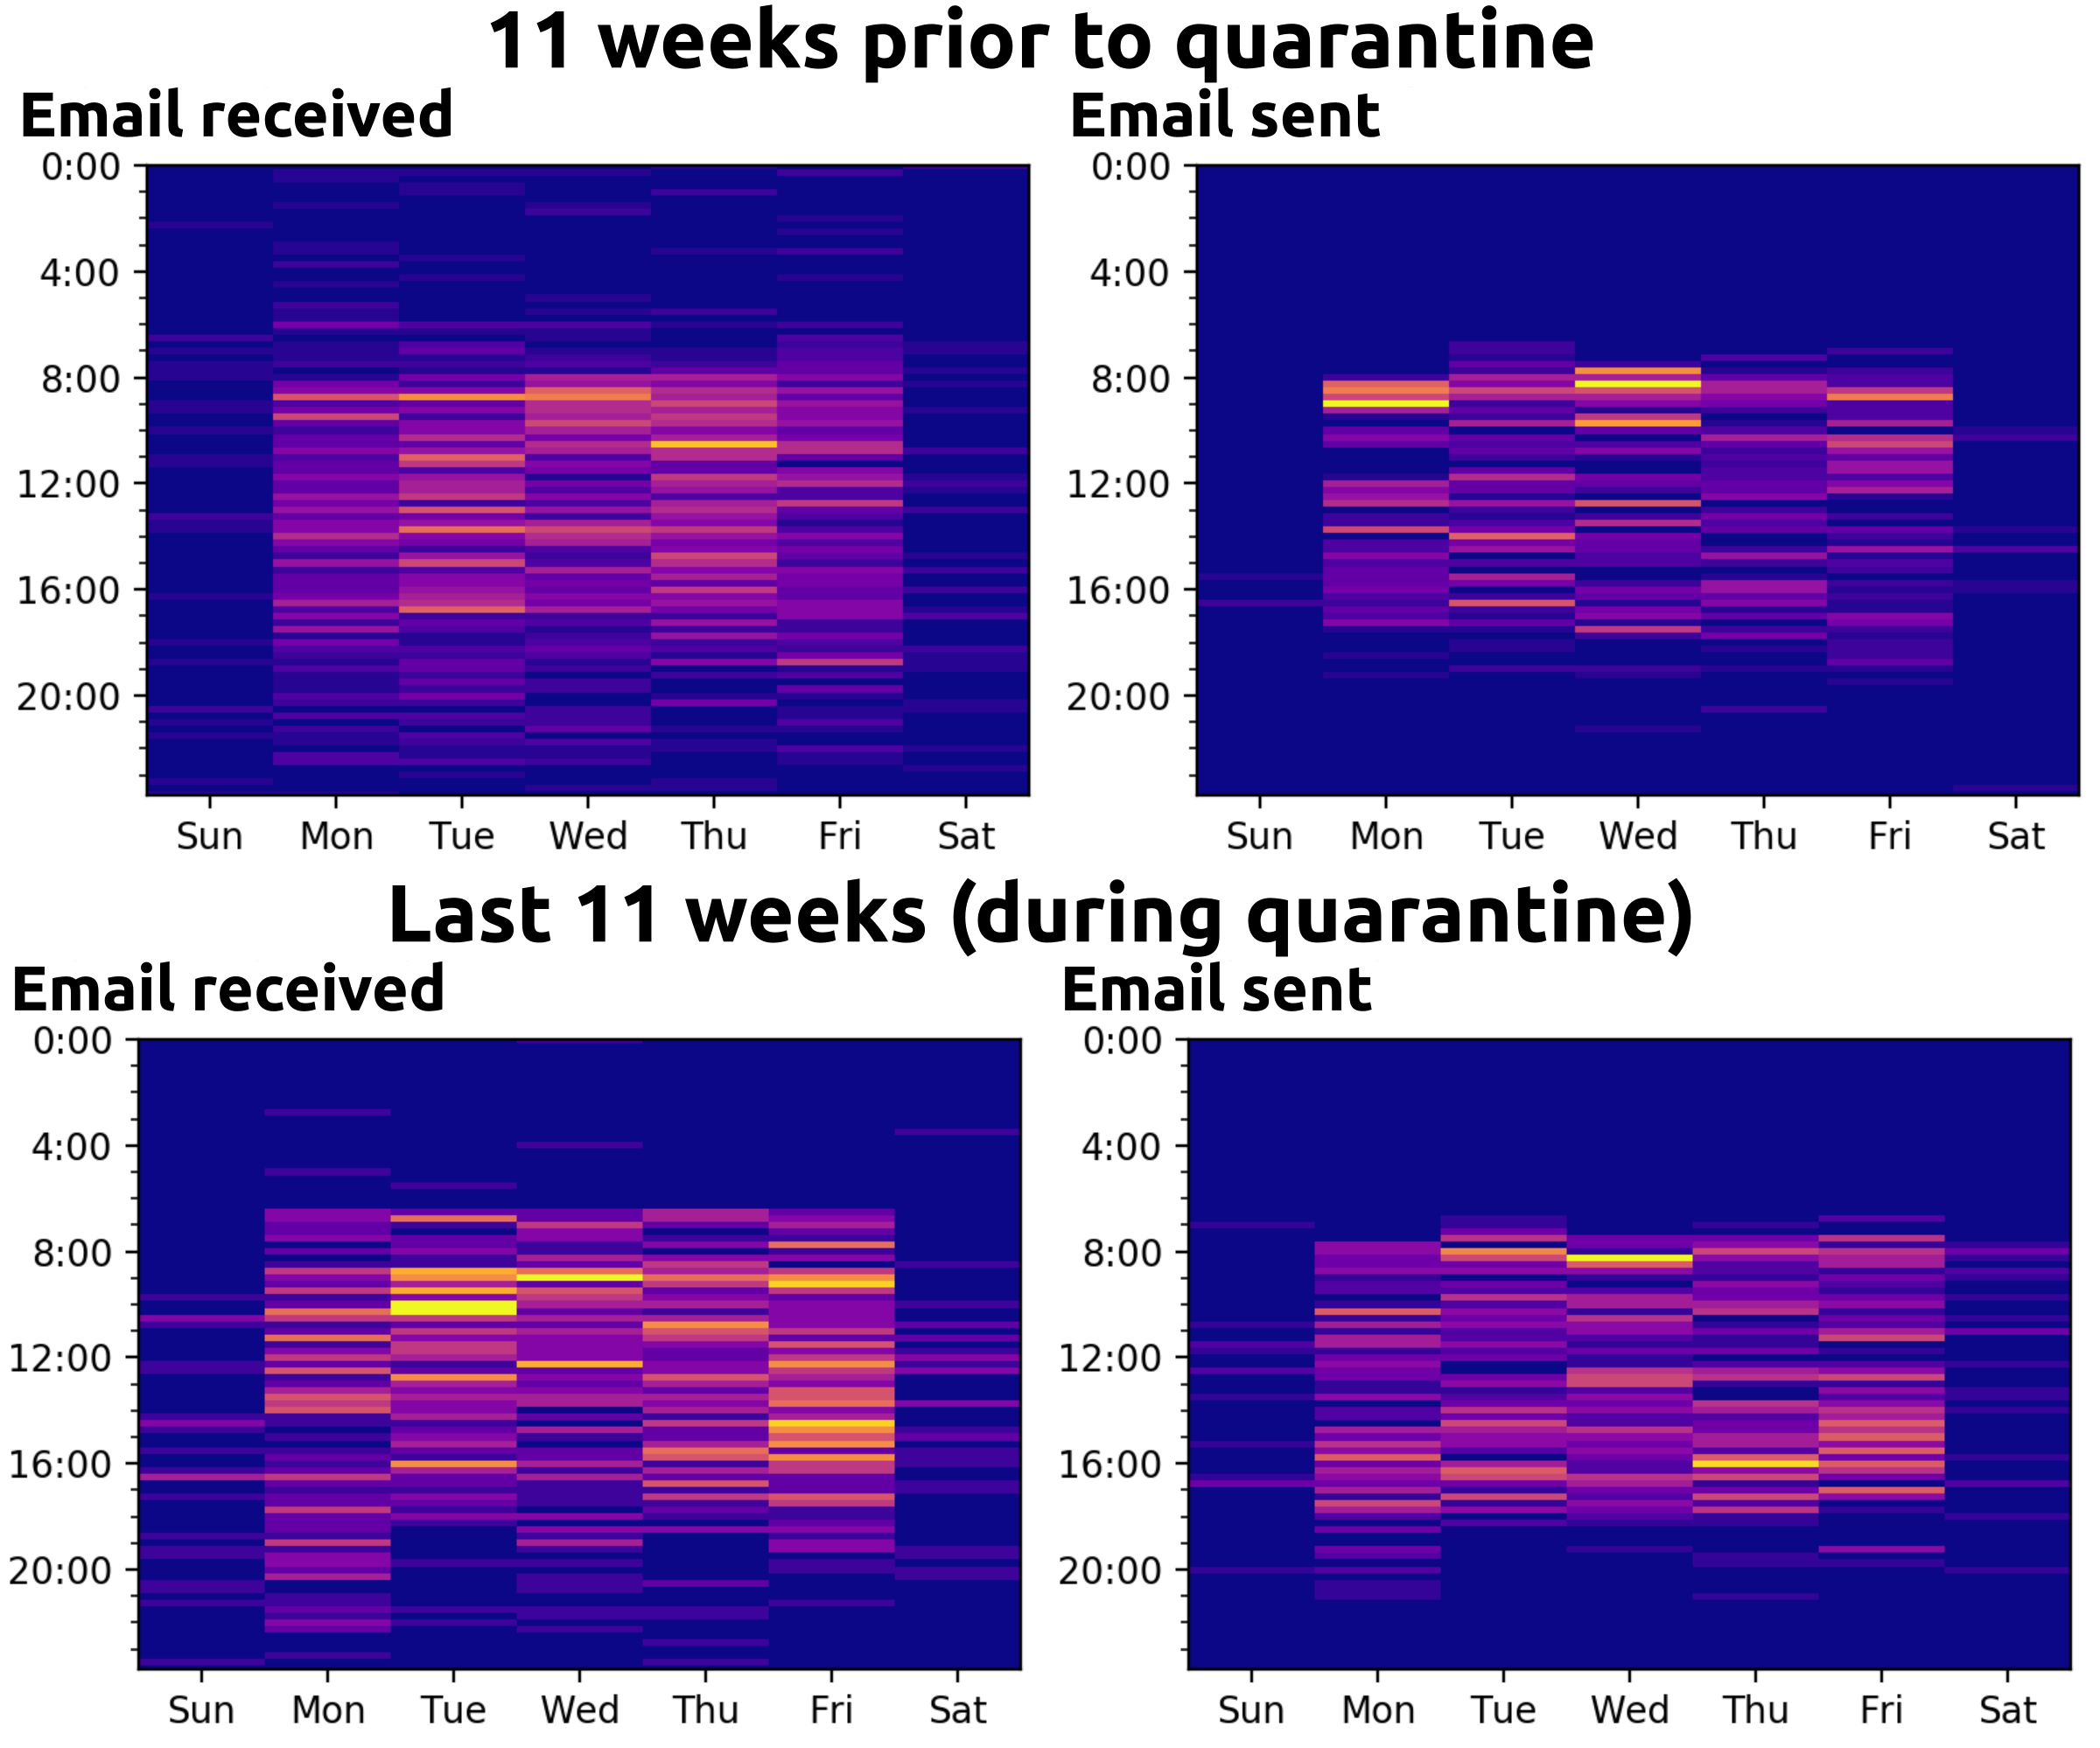
What changes do we see? I am receiving less external email than usual (not surprising, given how many collaborations are currently on hold). Email both sent and received is less contained to normal working hours. This is due both to crisis-management activities, and the blending of work and life.